


Series As seem really dilutive to founders
An observation about ownership

I posted this set of plots a few weeks back, and have been mulling over the shape of the Series A plot in particular.
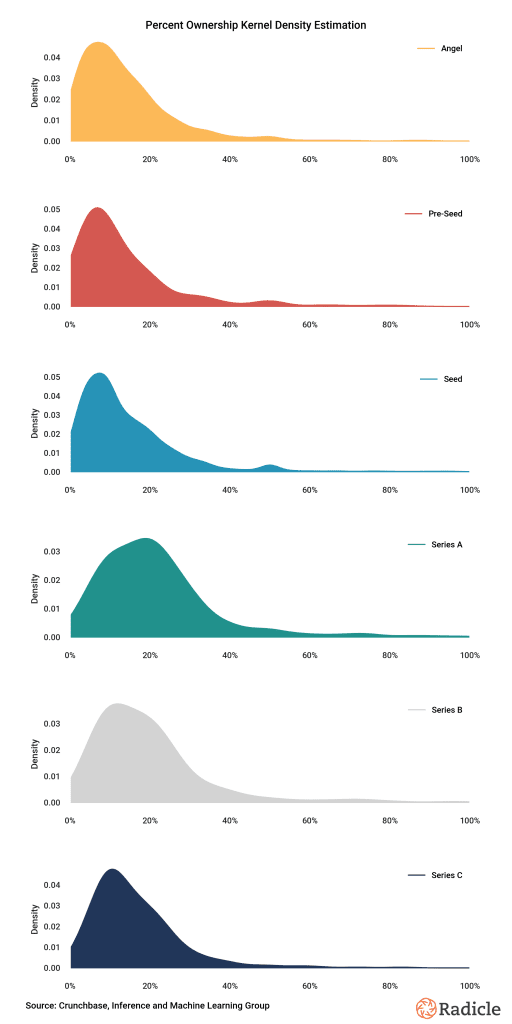
It has a central tendency farther to the right of the others, as well as a different shape. This suggests that Series As are taking the most ownership in startups by a material margin.
Initial Impressions
I want to start by stating that this is not a bad thing. The name of the game in startups (and this is as true for VCs as it is for founders and employees with equity) is that when the firm is sold, everybody wants to hold what may be a smaller piece of what will hopefully be a much, much more valuable company than exists when the investment is made.
Let’s put some numbers on that. From a cofounder’s perspective, 20% of a $1MM company is notionally worth $200k. That’s a lot less valuable than say 5% of that company in 15 years when it sells for $2B, which is then notionally worth $100MM.1 If that’s what happens, the cofounder has 75% less ownership, but a 100x increase in their financial outcome from an exit.
There will be dilution along the way, and as long as the value of the startup and its shares increases, everybody involved should be more or less happy.
It didn’t surprise me to find out that the Series As typically involve selling the largest fraction of a startup of any financing round that Radicle looks at. The historical first round of capital would probably need to take the most ownership to deal with the heightened risk of failure. Furthermore, the firm would be worth less than in subsequent financings due to unmitigated risks and lack of progress — so a similarly sized check would buy a greater fraction of the firm.
The development of Seed and Pre-Seed as institutional financing rounds, as well as the popularization of angel investing, doesn’t seem to have impacted this — and since they’re not typically priced rounds, it’s pretty clear why they shouldn’t.
But that answer felt uncompelling, and the shape of the Series A KDE plot was such an outlier, that I wanted to see if there was data to back it up.
The best place to start is with the source of the charts.
The 2019 article where I originally found the plots also considered the Series A plot remarkable, and quoted an expert who hypothesized that the reason was the relative difficulty in securing funding for Series A versus other rounds of financing.
Does this hold today?
Carta’s got a plot for everything, including dilution in fundraising. It covers from when the original article was written up until earlier this year.

Dilution seems to be generally trending downward, and this is particularly pronounced at the early stages.
Notably, it shows that Seed and Series A rounds tend to dilute founders the most. The gap between them has narrowed recently.
This next Carta plot suggests that the median Series A deal earlier this year was a $10MM investment on a $43MM pre-money valuation; investors bought about 18% of the startup. Over the past couple quarters, dilution has dropped even more than the plot above.

This seems broadly consistent with the Series A KDE and dilution over time plot.
The next thing to check is the attrition rate.
That’s much more difficult to evaluate (not every private company announces they’re shutting down publicly), so I looked at “graduation rates” to the subsequent round of financing instead.
Two years is a pretty normal time to go between fundraising rounds, because it provides both an opportunity for startups to promptly achieve the goals they pitch to investors, set new goals, and then go through another fundraising process — without burning too much cash.2
Carta has an infographic showing this over time for the Seed to Series A graduation rate.

It’s also worth looking at the Series A to Series B graduation rate. Carta has another infographic for that.

The title of this really says it all — it’s become quite difficult to raise a Series B on a 2-year timeline. It was never been particularly easy to secure the next round of investment, but this looks like a new phenomenon.
While they used to be almost equal, over the past 4 quarters with data, the average graduation rate to Series B within 8 quarters was 80 % of the comparable graduation rate to Series A.
Particularly over the last two quarters, the two year graduation rate to Series B has, as a fraction of the two year Series A graduation rate, dropped precipitously.
This shows that Series A financings are likely easier to bring together than Series B financings today, which is not consistent with the original article. But that’s fine, a lot can change about the startup fundraising environment in 5 years.
A quick check of the average graduation rates in 2019 shows that the average graduation rate to Series B within 8 quarters was almost exactly 100% of the comparable rate to Series A. Some quarters it was easier to get to Series A, and others it was easier to get to Series B. It is too close to call whether their data scientist was right in the year the original article was published.
Unfortunately, I wasn’t able to find a plot of the two-year Series B to Series C graduation rate, so I’m not sure where my initial intuition about graduation rates improving as a firm raises more rounds stands.
What the two Carta plots about graduation rates show definitively is that it is becoming more difficult to raise the next round of financing within two years.
Why might this be happening?
I see two likely causes here:
Early-stage VC expectations for progress have shifted
Early-stage VCs are having a harder time raising funds from their investors
My impression is that both of these things are happening — I’m really wondering how big the effect of each is.
To look at VC expectations for progress, I’d need to see data from a lot of investors across stages about what metrics they’re using to evaluate startups — and see how changes in that align with changes in graduation rates. This would probably be the more difficult data to collect.
To look at the VC fundraising issue more seriously, I’d want to look at relationships in recent graduation rate changes and changes during the past several years in
fund shut-downs
fund raises
number of active funds
average fund size
It is critical for founders and employees to understand that there’s a bunch of reasons this could wind up not working out exactly like this, like preferred stock, but it’s sufficient for a piece not about those topics.
There are a number of good reasons not to raise on a two year timeline that don’t involve any sort of business problem or shutting down. This is very much a first order approximation that I’m using because there’s plentiful data about it.